

BrightEdge Google Search Console Reporting
All Your Search Console Data, With the Insights Google Doesn't Give You
Google Search Console (GSC) is the most precise research database for Search, showing you the exact words people type into Google to find you. That data comes straight from the search engine that handles close to 90 percent of the world's search queries and every impression and click is triggered by a live user, not based on a synthetic model or panel data.
BrightEdge GSC Reporting takes that same data, makes it much easier to explore than with Google’s native UI, and adds several insights to make that data actionable. Specifically, it removes the limit Google's interface puts on how many keywords and pages you can see. It keeps a longer look back than Google's own dashboard allows and saves your filters, so you are not rebuilding them every time you open a report. BrightEdge GSC Reporting also connects the dots for you: why clicks dropped even as visibility climbed, which specific keywords and pages are behind any swing and where an AI Overview is quietly taking the click before someone reaches your page. And the best part is that all you need to do is connect Google GSC to your BrightEdge account which takes less than 1 minute.
GSC 1.png)
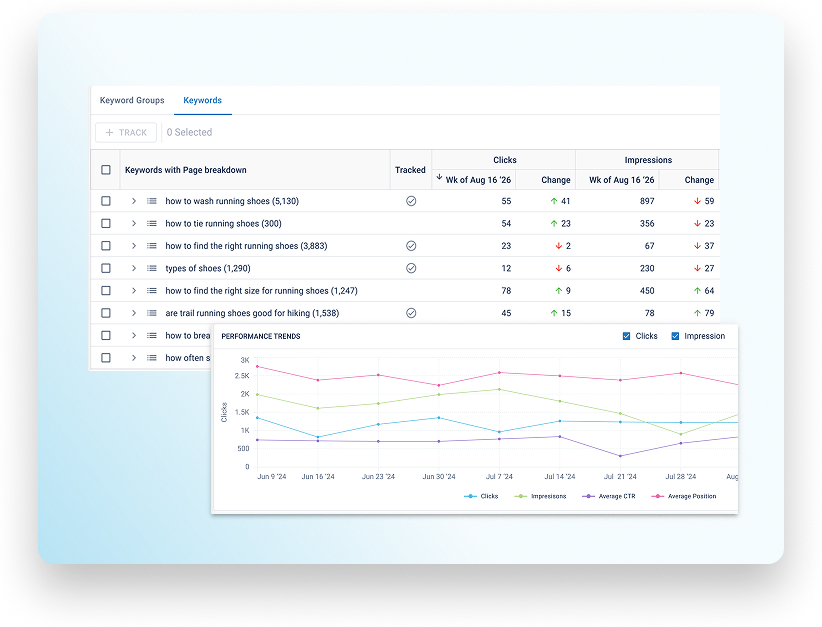
Complete Search Coverage
Native Google Search Console limits the keywords and pages it shows in its interface to 1000, so medium and large sites hit that ceiling immediately. BrightEdge GSC Reporting removes that limit and shows every keyword and page tied to your organic performance. You see the long tail of demand Google's own interface hides, and you catch swing in pages ranked below the cutoff before a drop in traffic looks like a mystery.
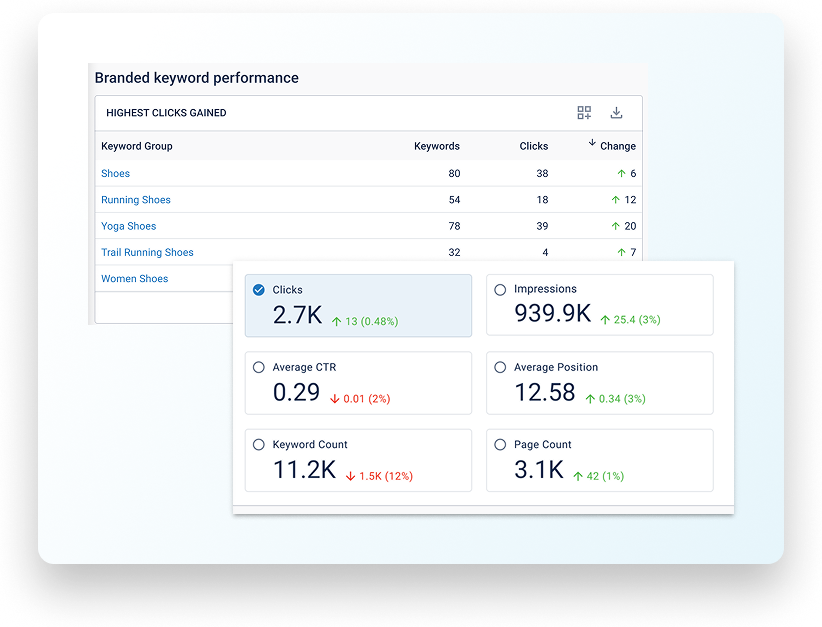
AI Impact Diagnosis
A common finding is that impressions climb while clicks fall. It looks like Native Google Search Console is telling two different stories at once. BrightEdge GSC Reporting filters your keyword and page performance by SERP feature, including AI Overview presence. This isolates the exact queries affected by AI. Each keyword also carries its exact (not broad) search volume next to the click and impression numbers, giving every drop real demand context. Now you can tell a real ranking problem apart from an AI Overview taking the click. You know whether the fix is better content and ranking or whether no ranking change would bring the click back.
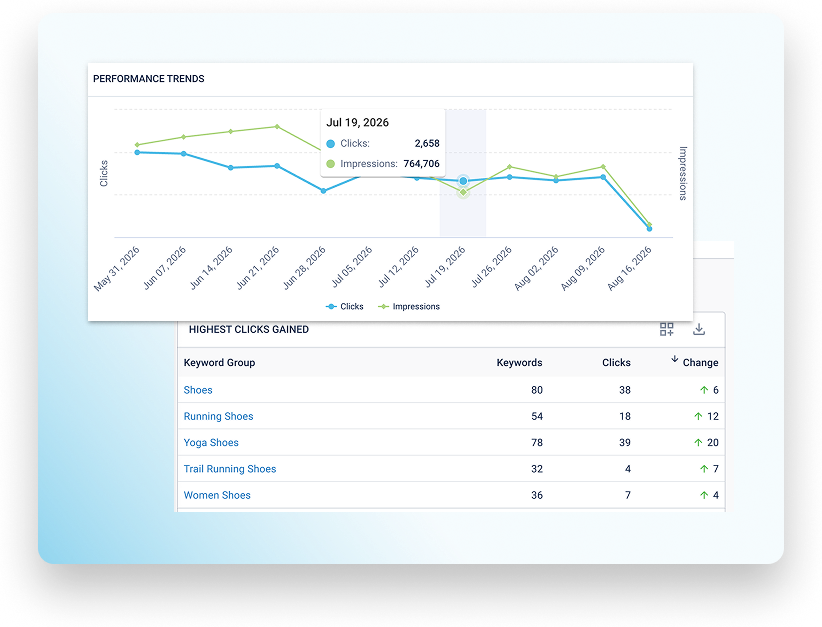
Performance Breakdown
BrightEdge GSC Reporting makes it easy to compare any two periods. That could be the last week against the week before, or the last quarter against the quarter before. It surfaces the keywords and pages behind the swing. You can split the view by branded and non-branded terms too, without rebuilding your filters every time you open a report. Every page links straight through to the keywords driving its clicks and impressions. That allows you to easily navigate from a high-level change to the specific queries causing it.
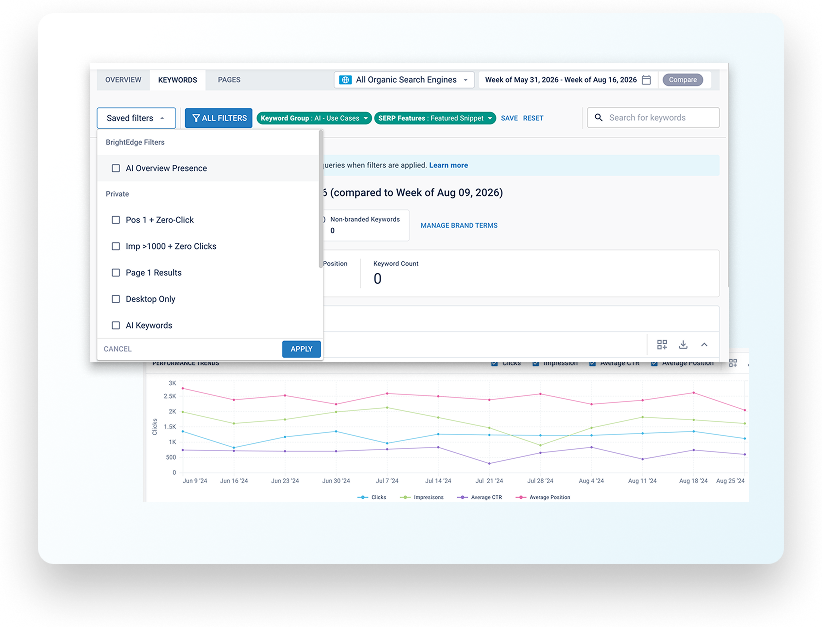
Custom Reporting
Native Google Search Console forgets every filter the moment you close the report. Keyword and URL filtering starts over each time. BrightEdge GSC Reporting remembers your branded terms, keyword groups and page groups. It applies them automatically to every report after that. You can group keywords by category. You can also build page groups from a bulk URL upload or an automatic page rule, such as everything under a specific subfolder. Once those groups exist, every future report opens with them already applied.
Ready to know why your traffic moved?
Frequently Asked Questions
Native Google Search Console limits the keywords and pages it shows in its interface. Larger sites with more organic traffic hit that ceiling the fastest. GSC Reporting removes that limit and shows every keyword and page tied to organic performance, with the same filtering and comparison tools available across the full data set.
A drop in clicks alongside rising impressions is a common pattern. It often means an AI Overview or another SERP feature is now appearing on those queries and "stealing” the click. BrightEdge GSC Reporting isolates keywords by SERP feature, including AI Overview presence, so you can confirm the cause before assuming a ranking loss.
Native Google Search Console requires a manual filter to be rebuilt for branded and non-branded terms every time a report runs. BrightEdge GSC Reporting classifies brand terms once and applies that split automatically across every report, chart and comparison going forward.
Native Google Search Console requires manually selecting two custom date ranges to compare. It has no saved year-over-year preset. GSC Reporting lets you compare any week, month or quarter against the same period a year earlier, in a couple of clicks. That helps you spot seasonal patterns a shorter view would miss.
BrightEdge GSC Reporting supports page groups built from a bulk URL upload or an automatic page rule, so you can view Search Console performance for a subfolder, template or content type without rebuilding a filter each time.
More than 700 BrightEdge customers already use GSC Reporting. It helps them catch the click loss AI Overviews are causing, an insight Google's own tool will not surface. It runs inside the BrightEdge platform your team already uses for keyword, content and AI search reporting. No separate login or export is required.